HOW TO USE DATA ANALYTICS TO BENEFIT FROM FIBONACCI RETRACEMENT LEVELS

MEANING OF FIBONACCI RETRACEMENT LEVELS
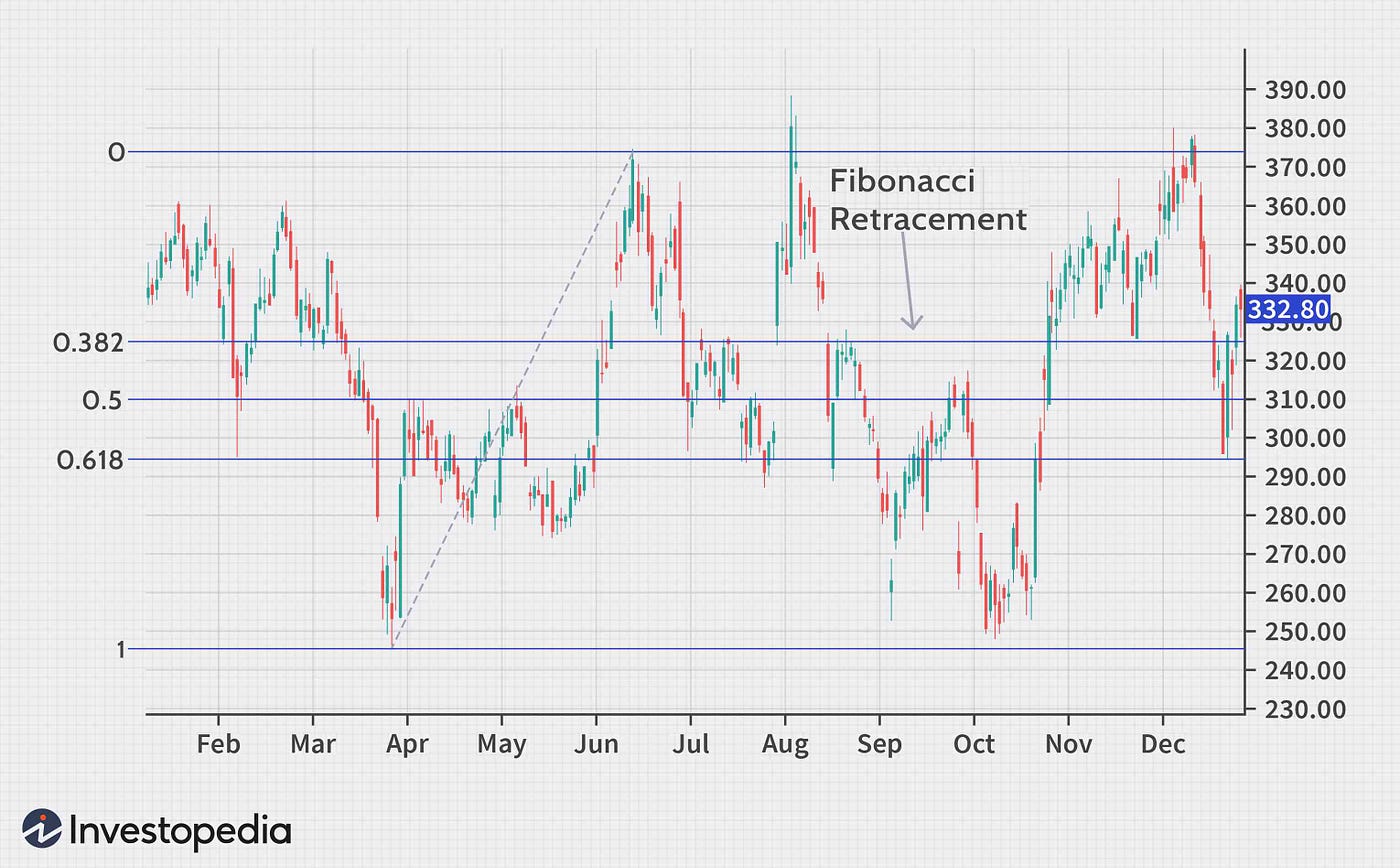
Any two points that the trader considers to be significant, often a high and a low point, are connected by Fibonacci retracement levels. The price could halt or reverse, as shown by the percentage levels. The most frequently utilized ratios are 23, 6, 38, 2, 50, 61, 8, and 78. It is risky to believe that the price will turn around once it reaches a particular Fibonacci level because these levels should not depend upon them.
Finance has undergone some significant changes as a result of data analytics. Financial organizations invest in big data technology to provide the best return on investment. Technical analysis is one strategy used by astute investors to make use of big data. They can improve the ROI of their trading techniques as a result. As a financial trader, this is one of the best ways to expand your portfolio utilizing data analytics.
WHAT JUSTIFIES THE USE OF FIBONACCI RETRACEMENTS?
Fibonacci retracement levels in technical analysis highlight critical places where a stock may reverse or stall. Typical ratios include 23.6%, 38.2%, and 50%. These intend to forecast the direction of a security’s price movement, which occurs between a security’s high and low points.
The Italian mathematician Leonardo Fibonacci initially identified the Fibonacci number series in the 13th century. Each number after the first two are 0 and 1, which is the sum of the two before it. As a result, 1+0=1 would come next in the sequence, then 1+1=2, 2+1=3, 3+2=5, 5+3=8, 8+5=13, and so on.
Trading professionals employ the Fibonacci ratios, derived from the Fibonacci numbers, to forecast possible support and resistance levels. The Fibonacci ratios 23.6%, 38.2%, and 61.8% are the most widely used ones.
FIBONACCI RETRACEMENT LEVEL RESTRICTIONS
The price may move past the retracement levels, which indicate potential points of support or resistance, without necessarily stopping there. Other confirmation signs are therefore necessary. The second argument against Fibonacci retracement levels is that there are so many of them that the price will almost certainly invert repeatedly around one of them. The problem is that it’s challenging for traders to foresee which one will be useful at any given moment. One could counter that the trader focused on a different Fibonacci retracement level when things didn’t work out.
HOW ARE FIBONACCI RETRACEMENTS USED?

Horizontal lines known as Fibonacci retracement levels show where support and resistance are most likely to appear. The Fibonacci ratios 23.6%, 38.2%, and 61.8% are the most widely used ones. Divide each number in the series by the one that comes just after it to find these ratios. For instance, dividing 21 by 34 yields 0.618, or 61.8%.
COMPARISON OF FIBONACCI RETRACEMENTS AND EXTENSIONS
Fibonacci extensions use to forecast price goals, while Fibonacci retracement levels highlight potential support and resistance levels.
Fibonacci extensions and retracement levels are the same set of Fibonacci numbers. On the other hand, Fibonacci extensions use division by two numbers farther down the sequence as opposed to dividing one number in the series by the number that comes after it. To find 23.6%, for instance, divide 21 by 89 (21/89=0.236).
They utilize a part of the technical analysis technique, Fibonacci extension levels. Fibonacci extension levels, for instance, can be used by a trader to identify a stock in a long-term uptrend and forecast prospective price objectives.
CONCLUSION
Trading professionals can utilize Fibonacci retracements to find levels of support and resistance. They can place trades, determine stop-loss levels, and create price goals using the information gathered. Although helpful, traders frequently utilize additional indicators to analyze trends more precisely and make wiser trading selections.